
As I tinkered with Splunk and ElasticSearch, so I thought I’d have a play with Arcsight Logger as well, I didn’t want to leave the third amigo in my SIEM blog out .
So another good logging tool, the install was based on 6.4 and RHEL7.3, the install was easy enough, you had to make some OS config changes and set up firewall rules or disable it for lab work. The install took around 10 minutes, again this is just a lab server, for the enterprise you would have to run through a performance, sizing, and storage exercise. You would also need to work the average EPS (events per second, this is based on your devices)
Logger comes with over 300 connectors, these are the components which collect the data from many different devices and send it via CEF (common event format – industry standard) or RAW to the logger. Most of the connectors are security based, but there some for Operations use cases. The collection of custom data can also be created using flex connectors. The data is normalised, this makes it easier to analyse the data, but raw data for compliance can also be presented should it need to be. All the data is indexed and compressed.
Logger comes as an appliance or software (appliances might be better for smaller companies)
So I collected a few logs locally, using the gui I was able to add the sources.
/var/log/secure
/var/log/messages
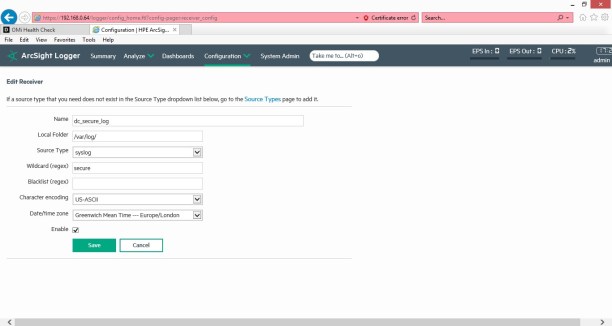
Once you save and enable the receiver, you should see the name on the main page, if you click on the name you will see the below raw data from the /var/log/secure log file.
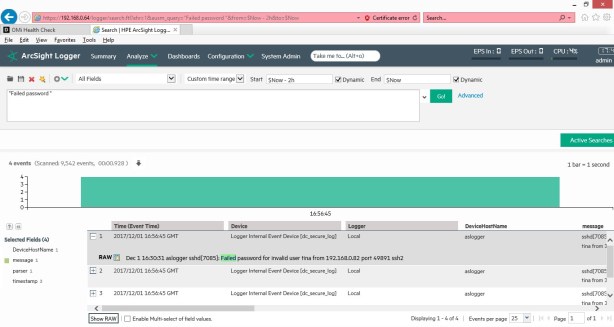
If you then type
“Failed password” you should get a similar chart as below.
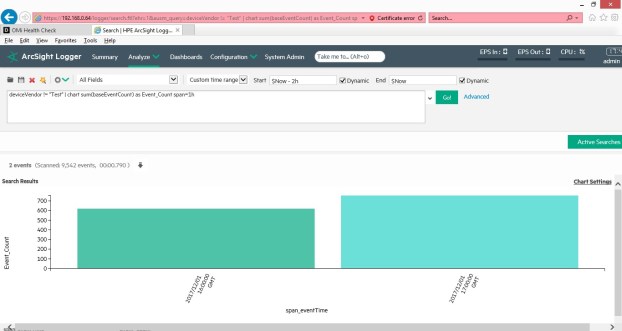
Another simple example of searching for data is like search command below, this shows, the total event count for each hour.
deviceVendor != “Test” | chart sum(baseEventCount) as Event_Count span=1h
I like logger, it’s a solid tool, the gui is great its easy to move around, there are many connectors to choose from, and the data once ingested can be forwarded to Operations Bridge Analytics (OBA), which is a cool analytics engine and other Arcsight managers such as (ESM). So in conclusion, have a play with each logging tool in a POC, see what works for you, remember put your admin hat on and think devops, security, ease of use and configuration, and don’t forget to look at the license costs, they all have different models, so you will need to run through an exercise on costs once you know what you’re going to monitor and what the architecture is going to be, a distributed architecture for the enterprise will add to the cost in terms of setup, license and maintenance. Define your use cases and map these to the technology, don’t collect every log, ensure the logs are good quality ISO 8601 standards, have a solid infrastructure in place, as this data will soon grow very large.
