Inside The Hackers Mind

All the details here are for education purposes only, I consider myself an ethical Cyber Security professional working in the data analytics – SIEM space, and this knowledge helps you protect against Cyber Attacks.
But what does that hacker or nation state want? Many reasons, these are some:

  1. DDoS or DoS Attack (This is to bring down a web site, loss of earnings, hate and competition)
  2. Data containing sensitive or financial information for reasons such as competition, ransomware, release to public for money, intellectual property, request the organisation or person provide money in exchange of their data should it be encrypted. Credit card details, Strategic secret plans as well.
  3. Hacktivist – a person who gains unauthorized access to computer files or networks to further social or political end. (Julian Assange was originally a hacker, turned hacktivist, now he’s going to prison and Snowdon is in Russia for the rest of his life, they won’t trust him and look at what Putin’s doing)
  4. An advanced persistent threat (APT) is a sophisticated, sustained cyberattack in which an intruder establishes an undetected presence in a network to steal sensitive data over a prolonged period.
  5. Privilege Access – If the hacker has root or Windows Admins privileges, its game over – these are the keys to the kingdom.
  6. Fun – yes, it’s cool to hack – but this often leads to prison time, or the authorities turn them around to help them. These are just some reasons, but as we have such complex IT environments, the threat surface is large and highly complex and therefore without good Cyber Hygiene we can open ourselves to these Cyber threats.

The hacker’s goal is not to hack every IP address on the internet, that’s plan dumb! They target specific servers that can provide data. If they come across old vulnerable servers, its fair game.
They hack public web sites (Banks) and use Phishing tactics, email links to get into HQ – production network.
They know all this is illegal, so they use various methods to hide and use USB sticks that contain the tools they use for the exploits. This is all in memory and data is refreshed each time its plugged in, TAILS is a good Linux OS for this, and so, it’s cat and mouse game we will always play.
Hackers and Nation States hide behind VPN’s using cloud-based services where they house their attacker systems running Kali Linux and other tools, this way they try and evade detection and prevent leaving footprints. So, their job is also hard and its illegal to hack an organisation and penalties are harsh. They will not use their home, work or places that would revel their location but rather use, cafes, train stations, public places and they try to avoid camera’s as well. (This is in-depth protection)
One thing they really want to do is use a tactic called Reverse Shell, they know Firewall’s block in-coming traffic, but they know outbound is not blocked, as this is required for traffic to flow out, otherwise how would we ever do online business.

If say we manage to get some software or Linux based OS, Rasberry PI onto the network, we can use SSH to create a tunnel between it and another server (Attacker) on the internet.
• Target Raspberry PI Or Server – SSH Port Tunnel 22 (mapped locally to use port 9999:localhost:22)
• Attacker Server on Internet – SSH Ports 9999


You then avoid changes to the password, as this can detected and use a public key pair, this concept, is how one gets access to the network, from inside out (Reverse Shell). From there you can start Nmap and discovery ports and services and continue with the hack.

We do have White Hat hackers, these are good guys, looking for vulnerabilities and advising organisations so they can be fixed. But there are Black Hat Hackers, these are the bad guys, and we need to protect ourselves from them. IP address’s can be traced back, and logs can reveal a lot of information, by collecting this data we can use it to defend and take hackers to court to face justice.
We do have what we call Penetration Test teams, (Red, Blue and Purple Teams, these guys test for vulnerabilities, and these are authorised to hack for this purpose to reporting back so they can be fixed before the hackers identify the vulnerability, without this how do we know how weak our systems are.
So how easy is it hack, well I can run Nmap, identify various services and ports opened for a target online server, then look for vulnerabilities based on the service, run Metasploit, work out the exploit and with a bit of tinkering and reverse shelling and I’m in, but this is Illegal, and you must not do this. All this hacking requires a good deal of knowledge, practise, and time, but it’s not that hard, and there are vast ways of exploiting systems, hackers do not know it all, but they work on target or new emerging technologies, learn them, and then exploit if they can. The more sophisticated hackers are ones that know C++ or other programming languages and can exploit system using their deep software engineering abilities.


Zero Day is the latest tactic – this is a vulnerability not yet patched by the products vendor, imagine this type of vulnerability that lets you into a Linux system as root and the OS Vendor does not know about it, game over!
So, what does these means for us, is we need protection, we use GOOD CYBER HYGENIE, start with Cyber Security Essentials and code of ethics.

SolarWinds Hack– Splunk & How to monitor Windows Registry Keys

So if you’re a Cyber Security Analyst, you should have heard about the supply chain hack!

If not then this is a good read. https://www.fireeye.com/blog/threat-research/2020/12/evasive-attacker-leverages-solarwinds-supply-chain-compromises-with-sunburst-backdoor.html

After the read, it was apparent, I could use this intel and do some monitoring using Splunk.(Oddly enough at the same time Fireeye one of the best cyber security companies were also hacked!!!, where do we go from here when they get hacked)

Anyway this blog is not to run through the hack details, but to demonstrate how one could detect if a service in Windows has been disabled using Splunk. As this is what the malware is trying to do based on various conditions, it’s a very stealthy malware, and runs after a 12-14 days and avoids sandbox environments, either way it tries to circumvent common services, such as carbon black and other other AV’s by disabling the Windows service.

Once this is successful, it starts to check as network connectivity for C2 operations, so by monitoring which services are being disabled, one can hopefully detect BAD stuff happening and respond quickly, time is key for cyber hacks.

The malware changes the HKLM\SYSTEM\CurrentControlSet\services\<service_name>\Start  to 4 (this is disabled as one of its many functions).

Windows Reference for services settings

0 = Boot
1 = System
2 = Automatic
3 = Manual
4 = Disabled

So here’s a very quick way to checking of any services have been set to disable.

We are going to us the Windows TA https://splunkbase.splunk.com/app/742, this has as part of the inputs a reg key change monitor.

[WinRegMon://hklm_run]
disabled = 0
hive = \\REGISTRY\\MACHINE\\SYSTEM\\CurrentControlSet\\Services\\.*
proc = .*
type = set|create|delete|rename
index = windows

Once the data comes in you can run a query like the below

index=windows sourcetype=WinRegistry action=modified object=start
| fields _time, action, event_status, object, object_path, registry_value_data, status, registry_value_type
| eval services_state = case(registry_value_data LIKE “%0x00000000(0)%”,”boot”,registry_value_data LIKE “%0x00000001(1)%”,”system”,registry_value_data LIKE “%0x00000002(2)%”,”automatic”,registry_value_data LIKE “%0x00000003(3)%”,”manual”,registry_value_data LIKE “%0x00000004(4)%”,”disabled”, true(),”Other”)
| table  _time, action, event_status, object, object_path, registry_value_data, status, registry_value_type, services_state

This gives you a table of the service that shows its status

From here you can run a timechart to see for any services that get set to disabled or set an alarm

index=windows sourcetype=WinRegistry action=modified object=start
| fields _time, host, action, event_status, object, object_path, registry_value_data, status, registry_value_type
| eval services_state = case(registry_value_data LIKE “%0x00000000(0)%”,”boot”,registry_value_data LIKE “%0x00000001(1)%”,”system”,registry_value_data LIKE “%0x00000002(2)%”,”automatic”,registry_value_data LIKE “%0x00000003(3)%”,”manual”,registry_value_data LIKE “%0x00000004(4)%”,”disabled”, true(),”Other”)
| search services_state=disabled
| timechart count by services_state  span=1h

You can then set an alarm if you start to see the number of disable services go up by hosts etc

index=windows sourcetype=WinRegistry action=modified object=start
| fields _time, host, action, object, object_path, registry_value_data,
| eval services_state = case(registry_value_data LIKE “%0x00000004(4)%”,”disabled”, true(),”Other”)
| search services_state=”disabled”
| stats count AS total_disable_services by host | where total_disable_services>0

There is still so much more you can do with Splunk such as DNS monitoring (Splunk Stream) which is used for C2, so this is just a small part to help with you cyber defence posture, so adapt this monitoring as you wish

Done!

Splunk SAI and Metrics

I recently had a play with Splunk SAI and I wanted to monitor a number of Linux Systems.

My options to collect metric data from the systems was to use collectd and send the data to HEC OR use Luke Harris’s TA-Metrics add-on https://splunkbase.splunk.com/app/4856/ and send the data to the indexers.

I opted for the metrics add-on as this seemed so much easier, the SAI has made it easier to deploy collectd + agent, but this TA to me was even easier, and it supports SAI.

I created a linux_metrics index in Splunk

[linux_metrics]
homePath = $SPLUNK_DB /linux_metrics/db
coldPath = $SPLUNK_DB /linux_metrics/colddb
thawedPath = $SPLUNK_DB/linux_metrics/thaweddb
datatype = metric
frozenTimePeriodInSecs = 2419200

The inputs.conf from the default folder is already set for you, its polls every 5 minutes for various metrics. I then created a local folder in the TA-linux-metrics folder and copied the process_mon.conf with below configuration.

[process_mon]
allowlist = CROND,run*,systemd*,chronyd,rsyslogd,auditd,journal,su,splunk,gnome-session,NetworkManager,dnsmasq-dhcp,dnsmasq,nm-dispatcher,snmpd,network,crond,accounts-daemon,gdm

I got the above process list from using the nix TA https://splunkbase.splunk.com/app/833/  I exported the process’s into a CSV file using a simple SPL as below

index=linux process=* sourcetype=top
| dedup process
| table process

After the config, I used the deployment server to deploy the TA-metrics to all the Linux systems, I could then see the data in the Analytics workspace in Splunk.

I installed SAI on to the Search Head – https://splunkbase.splunk.com/app/3975/

I install the SAI Infrastructure add onto the indexers https://splunkbase.splunk.com/app/4217/

Configured the macro sai_metrics_indexes to point to the linux_metrics index and I could then see metrics data with then entities in SAI App.

A Bigup to Luke’s TA – makes collecting metrics it so much easier and the SAI is great to monitor OS systems.

Splunk ISF

I’ve played with the stream component before, but not the ISF (Independent Stream Forwarder).

We wanted to ingest netflow data so had to use the ISF.

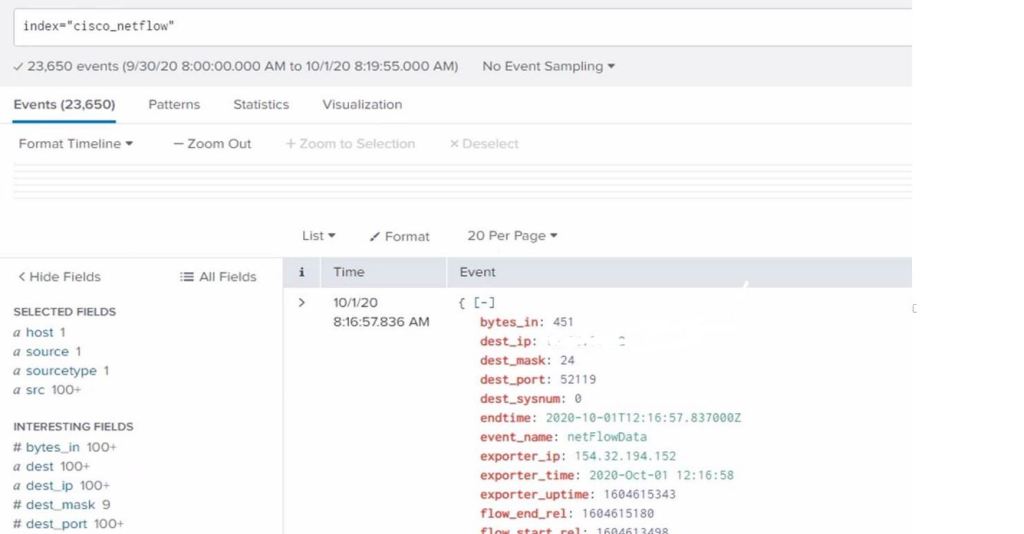
I created an index = cisco_netflow on my test AIO Splunk server

I configured this on a dedicated Linux server. When you install the stream app is creates a HEC point in  /opt/splunk/etc/apps/splunk_httpinput/local and you have to enable it before using it.

[http://streamfwd]
disabled = 0
token = ad4c40ab-b234-4a60-b2a5-2a8f61b2f9aa

 [http]
disabled = 0
#enableSSL = 0

I checked to see the HEC  not to point to a dedicated index, as the ISF sends its own logs to the _internal index, if you set it to a specific index, it will fail.

I configured the Stream App with the config with the ISF would use.

Log in to the search head (AIO) where the Splunk App for Stream is installed.

Navigate to the Splunk App for Stream, then click Configuration > Distributed Forwarder Management.

Click Create New Group.
Enter a name. For example, CISCO_NETFLOW.
Enter a description.
Click Next.
Enter CISCO_NETFLOW as the rule and click Next.
Do not select any options. Click Finish.
Navigate to the Splunk App for Stream, then click Configuration > Configure Streams.
Click New Stream > Metadata.
Enter Name as CISCO_NETFLOW.
Select NetFlow as the protocol.
Selecting NetFlow works for NetFlow, sFlow, jFlow, and IPFIX protocols.
Enter a description then click Next.
Select No in the Aggregation box then click Next.
(Optional) Deselect any fields that do not apply to your use case then click Next.
(Optional) Develop filters to reduce noise from high traffic devices then click Next.
Select the index (cisco_netflow) for this collection and click enable then click Next.
Select only the CISCO_NETFLOW  group and Create_Stream.
Configure your NetFlow generator to send records to the new streamfwd.

I then created a distributed forwarder group, used the name of the ISF as a regex match, so the stream app will deploy the config to it.

You then copy the install script command from the app and run it on the ISF server, you then check the streamfwd service and ensure it will restart on a reboot.

sudo service streamfwd start (only manual)
sudo service streamfwd status
sudo systemctl enable streamfwd (on reboot restart)

Run through the OS settings

https://docs.splunk.com/Documentation/StreamApp/7.3.0/DeployStreamApp/Deploymentrequirements

Now check the inputs.conf file, if its not configured then add below with your specs

[streamfwd://streamfwd]
splunk_stream_app_location = http://MY_SPLUNK_SERVER1:8000/en-us/custom/splunk_app_stream/
disabled = 0

Then configure the stream.conf

See the details https://docs.splunk.com/Documentation/StreamApp/7.3.0/DeployStreamApp/streamfwd.conf

Configure the device to send netflow data, if your config is good, you should see data in the index

Splunk Index Sizing Basics

Placeholder Image

You control index sizes by time, or disk size, this is simple guide on how to to that.

The default for index size is 500GB (0.5TB)

Create separate indexes, example, windows, linux etc.

Ingest the data, and over a 24 hour period see how much data is being ingested, use the SPL to see how much is coming, then tune the indexes.

You must have a data retention policy per index, otherwise the data will either just grow, your storing unnecessary data, you will require extra storage when not really required, you can’t apply RBAC per index. Do not send data to all one index not good practise.

Think like, how long would you want to keep windows and linux data for, perhaps 2 weeks, you may have other logs and you might to keep them for a 1 year, but this must come from the business as to how long to keep the data. If you don’t need it don’t ingest it or delete it when it’s old,  you also have the option to archive it.

Simple Example, in the real world the values will be much higher.

indexesCapture

If I want to keep windows indexed data for 2 weeks – 14 x 70 = 980 MB (1GB) Size / Time = 1209600

If I want to keep linux indexed data for 2 weeks – 14 x 35 = 490 MB (0.5 GB) Size / Time = 1209600

Once the index reaches maxTotalDataSizeMB or frozenTimePeriodInSecs data is deleted, optionally frozen, most restrictive wins.

Use the SPL to check index sizes, then adjust your indexes.

| rest /services/data/indexes
| rename title AS Index_Name
| rename currentDBSizeMB AS Index_Size_MB
| eval Index_Size_GB = round(Index_Size_MB/1024,3)
| stats values(Index_Size_MB) by Index_Name, Index_Size_GB,Index_Size_MB
| sort – values(Index_Size_MB)


Ingest SNMP Data Into Splunk

I recently had to configure Cisco SNMP data into Splunk, so thought this might help, on how I did it. I was lucky enough to come across this very good Splunk article on SNMP data into ITSI – so a Big up to Liz Snyder https://www.splunk.com/en_us/blog/it/managing-snmp-traps-with-itsi-event-analytics.html  I used info in here and made some adjustments for my environment which gave me a good head start, why re-invent the wheel, just pimp it up or Splunk it UP!!

My changes were to change the host name so it comes from the device, add some CIM mapping, and send the header data on restart to null.

My environment:

Linux Centos 8 / Splunk 8.5

Step 1 Install and Configure SNMP

sudo yum install net-snmp net-snmp-utils
sudo systemctl enable snmpd
sudo systemctl enable snmptrapd

sudo systemctl start snmpd
sudo systemctl status snmpd -l
sudo snmpwalk -v 2c -c public -O e 127.0.0.1

Step 2 Make snmp log file

mkdir /snmp
cd /snmp
sudo touch  ./traps.log
sudo setfacl  -R -m u:splunk:rx /snmp/traps.log

Step 3 Config SNMPD conf

This will load the snmpd config and all the MIBS and point to the log file called traps.log

vi /etc/sysconfig/snmptrap

OPTIONS=”-c /etc/snmp/snmptrapd.conf -A -n -Lf /snmp/traps.log -OQ -m +ALL –disableAuthorization=yes -p /var/run/snmptrapd.pid”

Step 4 Config SNMTRAPD conf

This formats the SNMP data

vi /etc/snmp/snmptrapd.conf

# snmptrapd formatting

#http://www.net-snmp.org/wiki/index.php/TUT:Configuring_snmptrapd_to_parse_MIBS _from_3rd_party_Vendors

# SNMPV1

format1 Agent_Address = %A\nAgent_Hostname = %B\nDate = %y-%02.2m-%02.2l %02.2h:%02.2j:%02.2k\nEnterprise_OID = %N \nTrap_Type = %w\nTrap_SubType =%q\nCommunity_Infosec_Context = %P\nUptime = %T\nDescription =%W\nPDU_Attribute_Value_Pair_Array:\n%V\n%v\n—\n

# SNMPV2

format2 Agent_Address = %A\nAgent_Hostname = %B\nDate = %y-%02.2m-%02.2l %02.2h:%02.2j:%02.2k\nEnterprise_OID = %N\nTrap_Type = %w\nTrap_SubType = %q\nCommunity_Infosec_Context = %P\nUptime = %T\nDescription = %W\nPDU_Attribute_Value_Pair_Array:\n%V\n%v\n—\n

Step 5  Check and enable SNMP Services

sudo systemctl restart snmptrapd
sudo  systemctl status -l snmptrapd
sudo systemctl enable snmpd
sudo systemctl enable snmptrapd

Step 6 Check MIBS

Check /usr/share/snmp/mibs this should have a load of mibs, should add any new ones into this folder from the Ciscos Web site

https://www.cisco.com/c/en/us/td/docs/routers/access/4400/technical_references/4400_mib_guide/isr4400_MIB/4400mib_02.html

Step 7 Send some test traps

sudo snmptrap -v 2c -c public localhost ” 1.3.6.1.4.1.8072.2.3.0.1 1.3.6.1.4.1.8072.2.3.2.1 i 123456
sudo snmptrap -v2c -c public localhost 1 1

sudo tail -f /snmp/traps.log

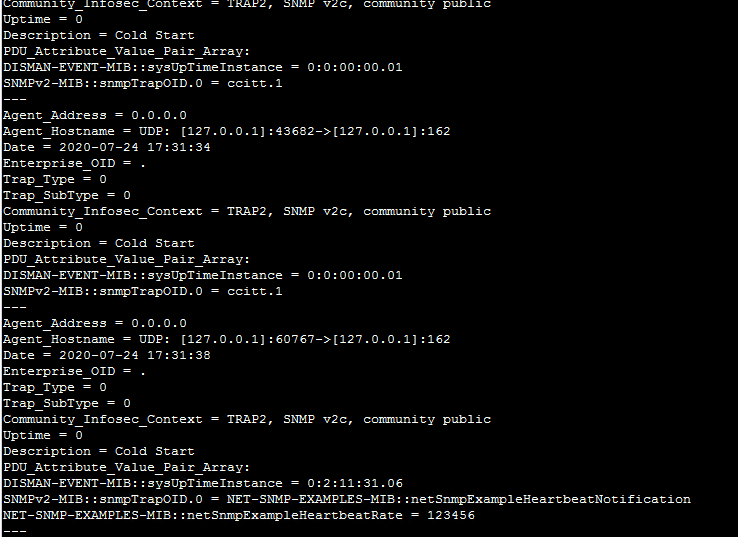
You should see data, as the formatting is Key value pairs, this will get parsed easily

snmp1

Step 8 Create Inputs / Props / Transforms conf

Inputs.conf

[monitor:///snmp/trapd.log]
disabled = false
index = snmptrapd
sourcetype = network:snmptrapd

Props.conf

[network:snmptrapd]
KV_MODE = auto
LINE_BREAKER = ([\r\n]+)Agent_Address\s=
MAX_TIMESTAMP_LOOKAHEAD = 30
NO_BINARY_CHECK = true
SHOULD_LINEMERGE = true
TIME_FORMAT = %Y-%m-%d %H:%M:%S
TIME_PREFIX = Date\s=\s
disabled = false
pulldown_type = true
TRANSFORMS-null = setnull

#Change host name
TRANSFORMS-hostname = snmpdevice

#Add Report Extract for Delims
REPORT-snmpfields = kv_snmp

#Added For CIM Mapping
#Extract CIM Fields
EXTRACT-CIM-fields = Agent_Hostname\s=\s(?P<protocol>.+):.*\[(?P<src_ip>.+)\]:(?P<src_port>.+)->\[(?P<dest_ip>.+)\]:(?P<dest_port>.+)$
FIELDALIAS-dvc = src_ip AS dvc
EVAL-direction=”inbound”
EVAL-app=”SNMP”

#This sends unwanted data to null
Transforms.conf
[setnull]
REGEX = ^(NET.*)
DEST_KEY = queue
FORMAT = nullQueue

#This changes the host name
[snmpdevice]
REGEX = Agent_Address\s=\s(?P<snmpdvc>.+)
FORMAT = host::$1
DEST_KEY = MetaData:Host

#adds delimiters to extracted fields
[kv_snmp]
DELIMS = “\n,” =”

Step 9 Generate more SNMP tests and you should see the trap in your snmptrapd index

snmp2

Splunk’s info Sec App

Placeholder Image

Last year I was creating my own Cyber Defence app based on data models, due to time and projects this was slow in terms of completing it…Then, this was released, I had a peep and it’s so good, I wanted to mention it.

It’s really for small – medium customers that cannot put in place Splunk (SIEM) Enterprise Security Application solution, which is extra cost and requires careful design, install and config.  That said I have implemented Splunk’s ES SIEM for a small number of customers as they required it for ISO 27001 compliance.

So this InfoSec app, provides out of the box dashboards, alerts, and searches that will give instant value. It does require you enable the data models, this is the normalisation of the data from multiple security log sources, but once this is in place, the lights come on and boy is it good value – its free!

https://splunkbase.splunk.com/app/4240/

This is from my lab, you can see the various dashboards.

infosec1

Monitoring Apps Dev Under Lockdown!

Placeholder Image

So its been a few weeks under lockdown, at home…so I thought I’d create a few Splunk apps and keep my sanity…

All these app can be used with the free version of Splunk and people say its expensive! (Of course not at the enterprise level, but if you have a small environment, you can get a lot of value from it)

This simple apps provides a great way of looking at Windows and Linux system metrics, pings your critical servers, and checks your web site for up down status,  its simple to use, and there’s some basic inventory and service information.

https://github.com/iopsmon/dc_iopsmon

iopsmon


I cant support any of these, but feel free to use in a test environment and adopt if need be.


COVID-19

Placeholder Image

I wanted to use the COVID-19 data to build a dashboards on this data set, more from a learning exercise and whilst going through the epidemic, it also being different to the security dashboards I tend to work on.

The data used is from John Hopkins

NOTE: Since posting this, the data keeps getting changed, so unless you keep track, the data will not be displayed, but its good for learning.

https://github.com/CSSEGISandData/COVID-19

The data shows a number of stats, mainly focused on the UK.

UK Total Confirmed Cases
UK Total Deaths
UK Total Recovered
World Total Deaths
World Total Confirmed
World Total Recovered
Deaths and predicts over time
Table / Confirmed / Recovered / Deaths
Deaths Geo Map

covid_19_screen

The data is based on CSV and was updated once a day. I used git to copy the csv files and load them into Splunk. This was done using a props and transforms file based on the data and csv format.

The app can be found here, you can download and upload the app, it does contain some initial data, but you will need the shell script to update the data.

https://github.com/iopsmon/covid_19

Splunk Machine Learning (MLTK)

Placeholder Image

Spot process anomalies using Machine Learning Tool Kit

I thought I’d use the Splunk MLTK app to get familiar with it, and apply it to monitor unusual processes.

The app can be found from the below links, you also need the Python for Scientific Computing (for Linux 64-bit)

https://splunkbase.splunk.com/app/2890/
https://splunkbase.splunk.com/app/2882/ (Linux)

I had to ingest windows process data into Splunk, I used the Windows TA – https://splunkbase.splunk.com/app/742/

In production you would use the MLTK on a dedicated server, read the official documentation here https://docs.splunk.com/Documentation/MLApp/4.1.0/User/Installandconfigure

So after installing it I wanted to use the Detect Categorical Outliers which will find events that contain unusual combinations of values, this could be a good way of finding rogue process in your Windows environment.
From the MLTK, click on Experiments, and then Detect Categorical Outliers

mltk1

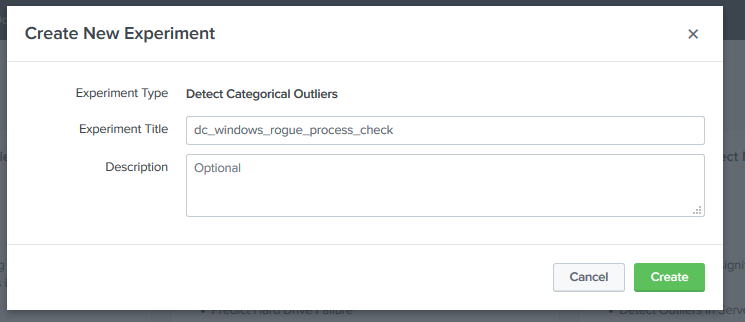
Give it a name and create


mltk2


I wanted to do the experiment on Windows process’s so I used the below SPL
SPL = index=windows sourcetype=WinHostMon Name=*
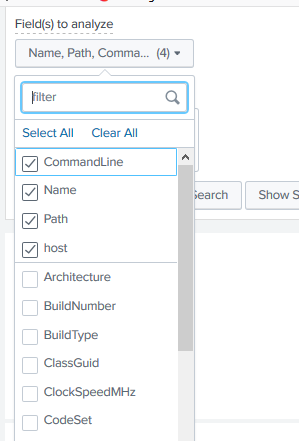
And then select the Fields you want to analyse which is Name, path, CommandLine, host (This is key to to the machine learning, you need to know which fields will provide data)

mltk3

Then press Detect Outlier button
The experiment on this data will show up with some results, you can see from the below screen shot there are some outliers, if there were some unusual process, this may alert you. My lab is limited and I don’t have rogue process, but in the real world this could be a great tool to look for unusual process activity and then send an alert

Here it shows 3 outliers across 31952 events, “This search has completed and has returned 31,952 results by scanning 58,378 events in 4.091 seconds”. This is cool, my test environment is not quite c4.8xlarge but you get my point, if I had a fully optimised Splunk environment it would be faster.
Look at the CommandLine field it shows these are outliers from this server, cool hey, ok this is a false positive, but when you have lots of data, and run this in a production environment, it could be invaluable in showing what process outliers you have in your Windows Environment.

mltk4

The MLTK also shows you the SPL, which is showing you how the algorithm is ran. You can find out more info on this from here https://docs.splunk.com/Documentation/Splunk/7.2.4/SearchReference/Anomalydetection#Examples

mltk5

So the Splunk MLTK is a great place to start with anomaly detection and other algorithms, it does requires you to think about what data you want to analyse, so start with some simple experiments and play around until it makes sense to you.
Save the experiment.

Done