SIEM (Security Information and Event Management), this is another area of monitoring that has come into the foreground of monitoring, with all the hacks, this should be the top priority for all organisations.
The aim here is to consolidate logs from many different sources in real time, this is typically (structured /unstructured, firewall, snmp, dns, switch, router, ldap, ids, apache/iis, database and application logs), once this data is received and ingested into the tools engine, it is normalised or index it in such a way that you can run searches, create time series charts, correlate, retain the data for compliance, alert all in real time, these are some of the features and they work really well and fast at it. The reason it’s so fast is that they don’t use the traditional database schemes for accessing the data you want, the datasets tends to be on files which are compressed and indexed and thus the tools can search the data, a bit like googling.
Data is typically collected via agents which come in one form or another, regex can be used to parse the data or the rawdata can also be ingested. As the time stamp is typically recorded on the logs, it’s often use as part of the time series charts.
I started to have a look at two SIEM solutions, as they seem to be the ones many people talk about these days, but there are many other logging solutions and they are not for just SIEM, you can also get business related data, such as how many users bought this product from logs.
I wanted to get a feel for them, and find out how easy or complex they were to use and present some data. This is not a full on review, but I always try to put on my admin hat from many years ago to see how it works under the hood and if I would take to it.
Basic Assessment Criteria:
- Easy of install and config
- Easy of getting data into the engine ( Apache / Security logs is what I looked into)
- Easy of presenting the data
- Documentation Quality
Both on RHEL6.5
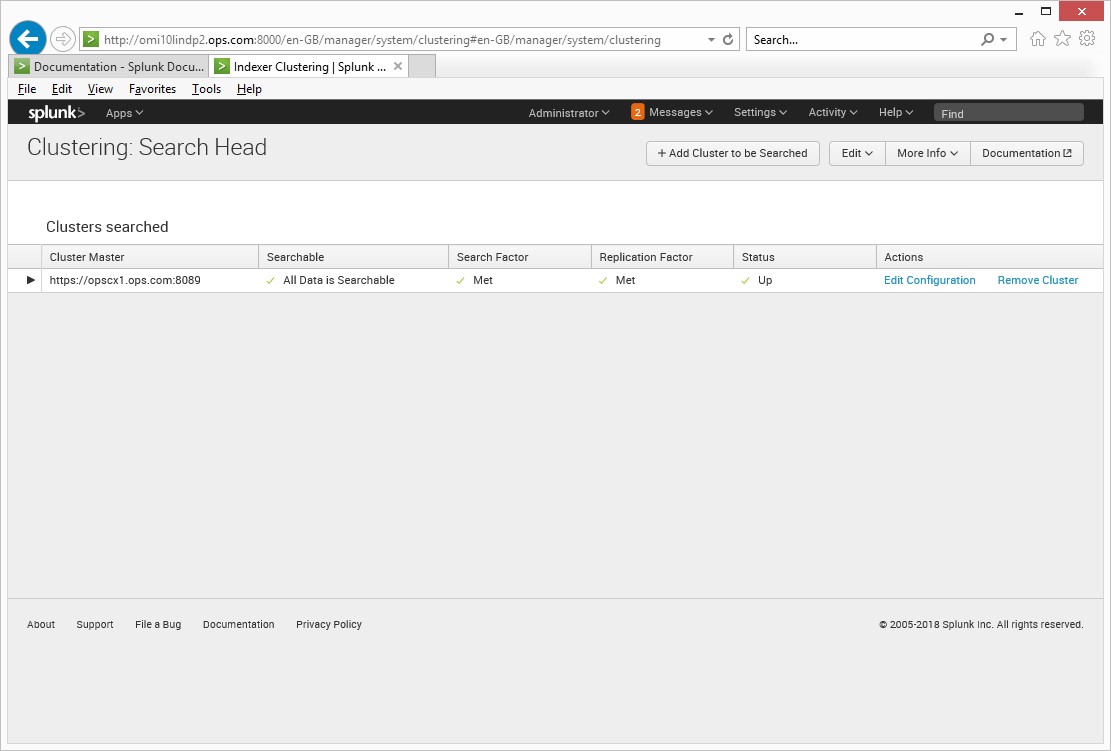
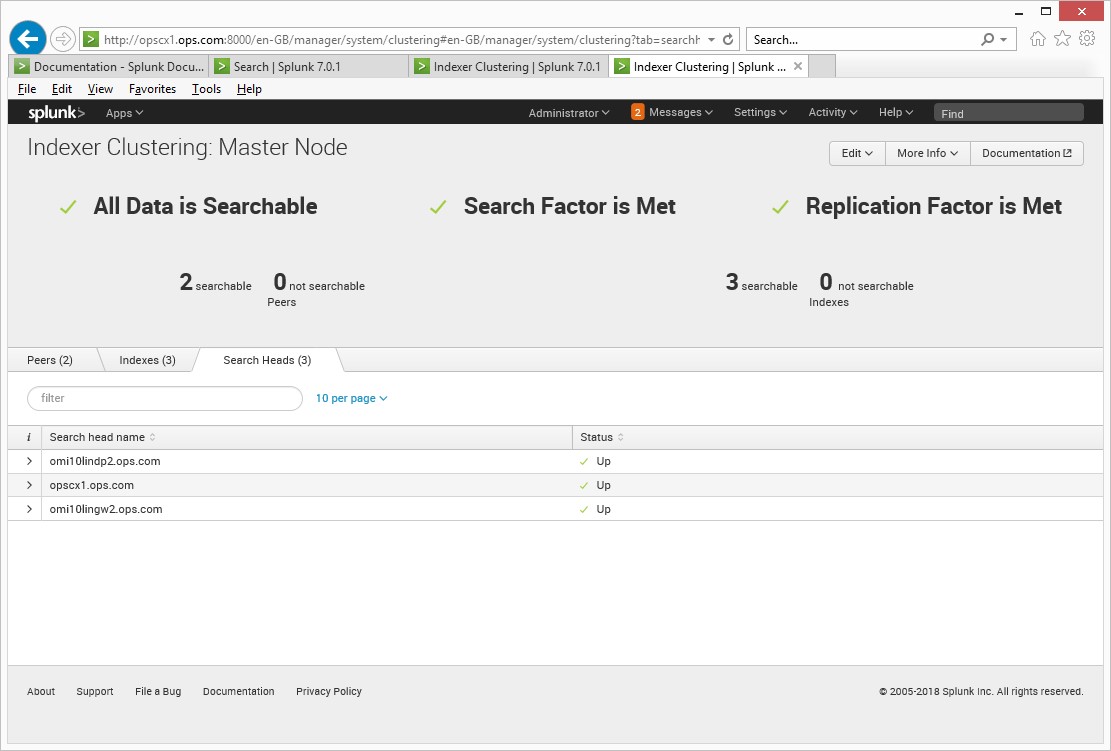
Splunk 7
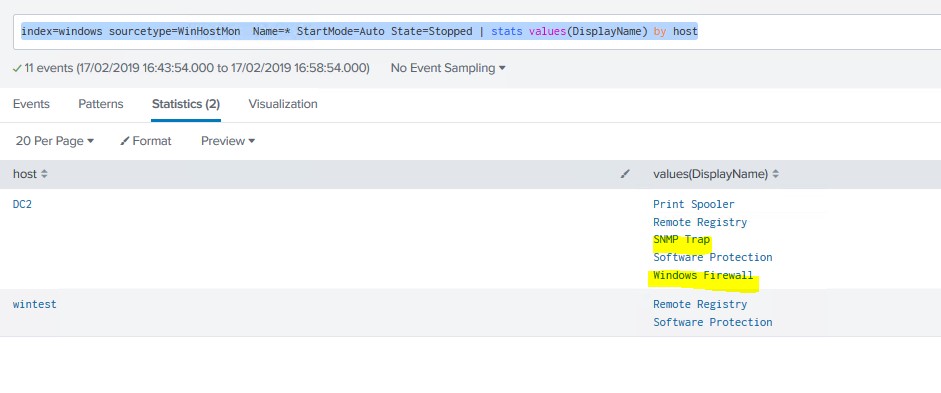
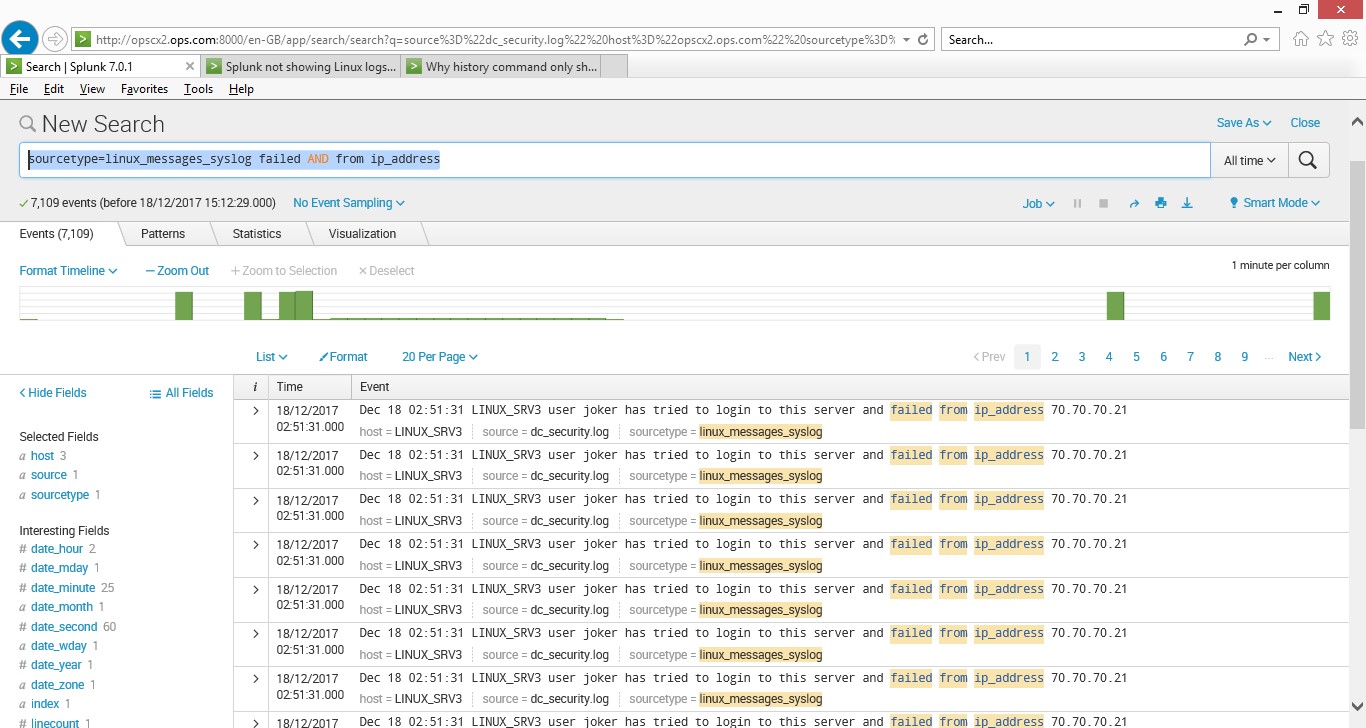
Install and config on my RHEL65 server was easy, I configured a forwarder to point to the logs I wanted to and point it to the Splunk server which was doing all the collecting, indexing and parseing, it has a feature which will detect which type of data source you are from the logs. Once the data was in I could run my searches, the data source was linux_secure
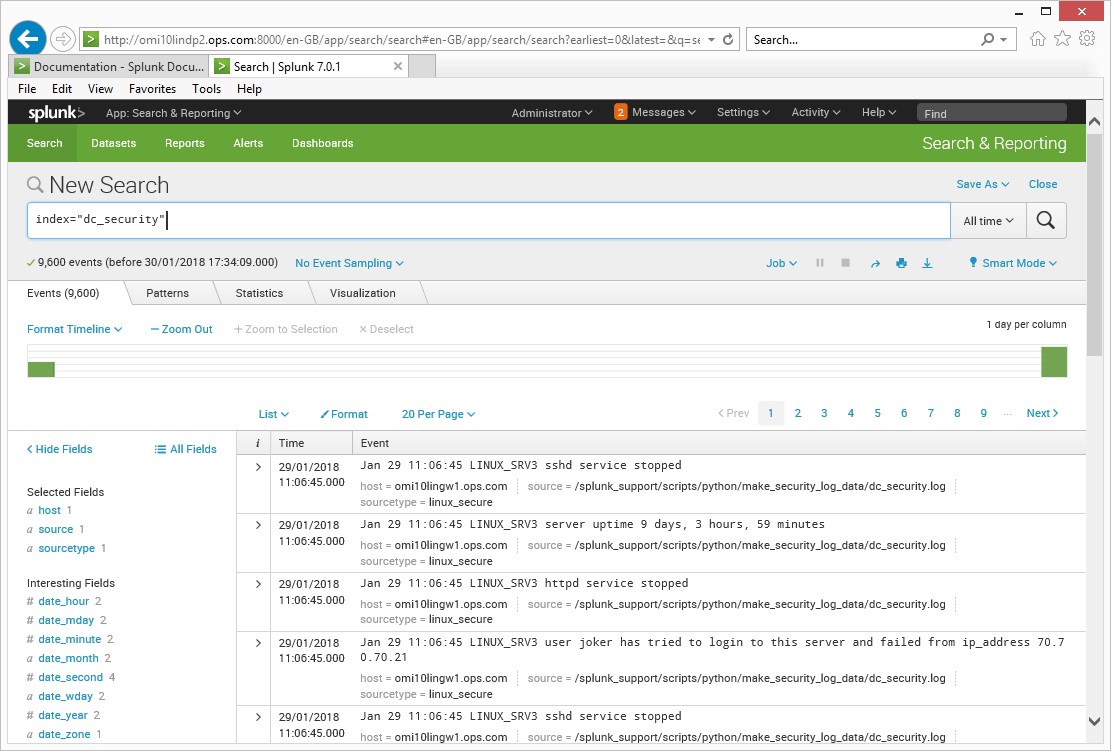
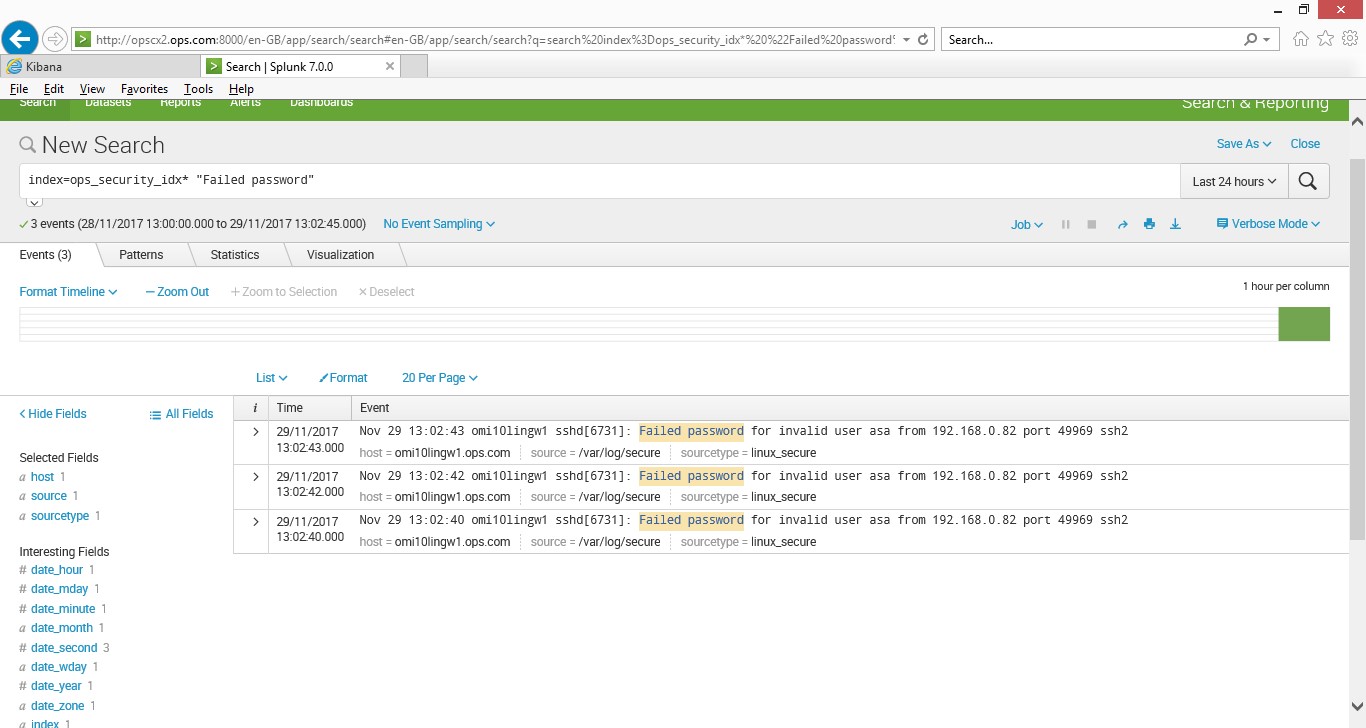
This simple query shows the data from the /var/log/messages log file
index=ops_security_idx* “Failed password”
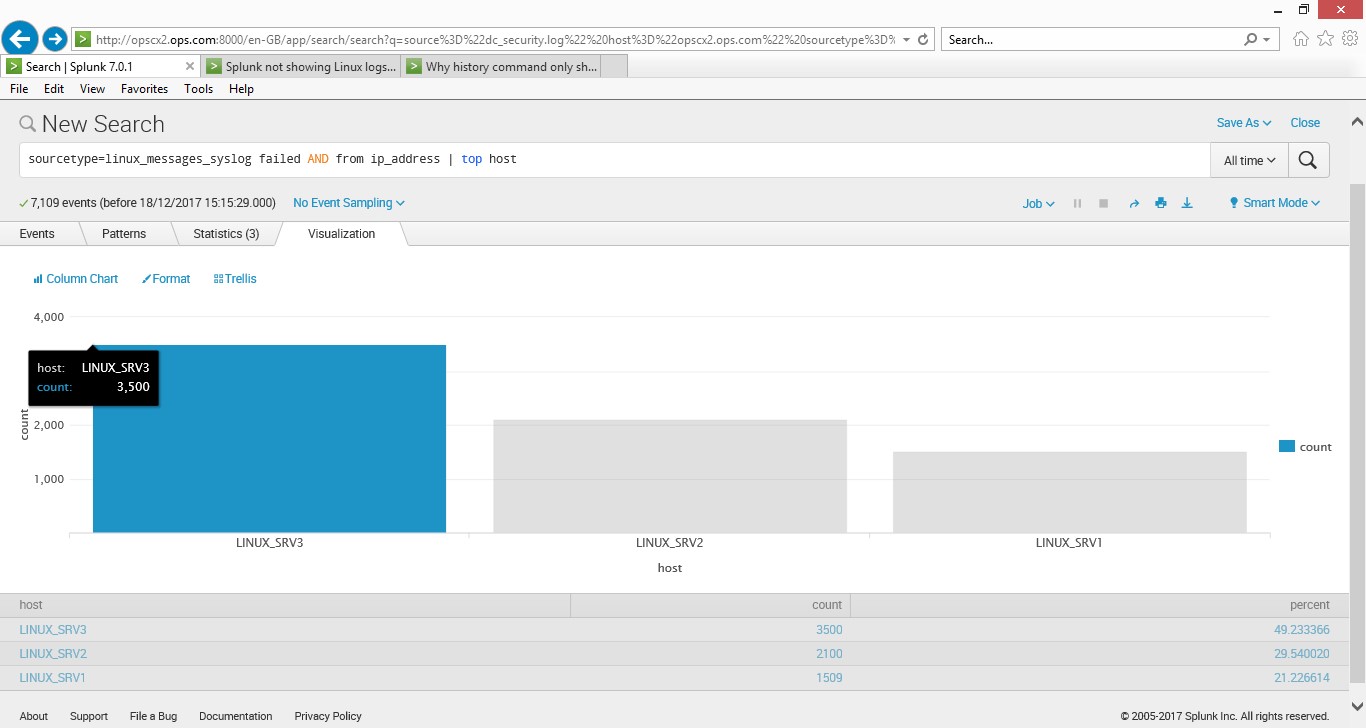
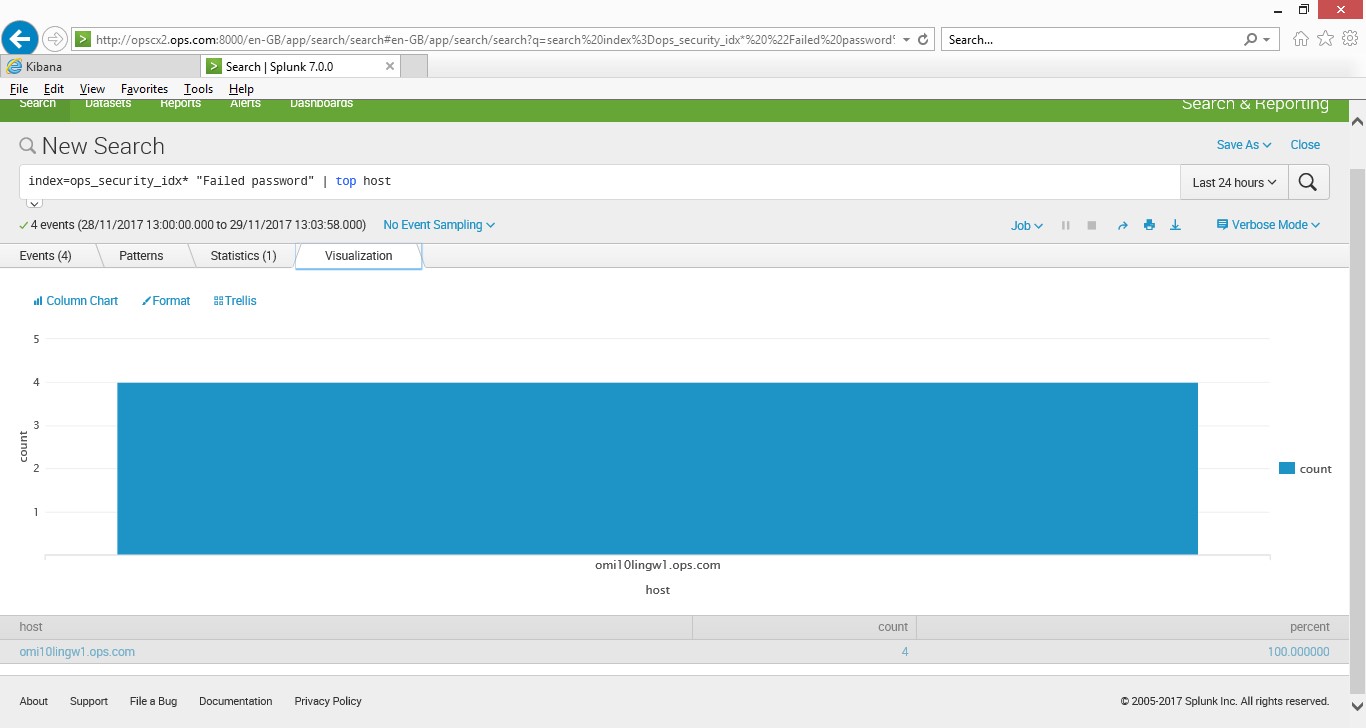
This simple query shows the data in a chart (I know it’s only from server, but if you a thousand servers you could scan the data in a short time and find which are the top ones are having logging failure, this could show which servers are the ones someone is trying to get into, simple but very effective)
index=ops_security_idx* “Failed password” | top host (this uses my index called ops_security and searches for the string “Failed password” then pipes it to the function top which then uses the host field.
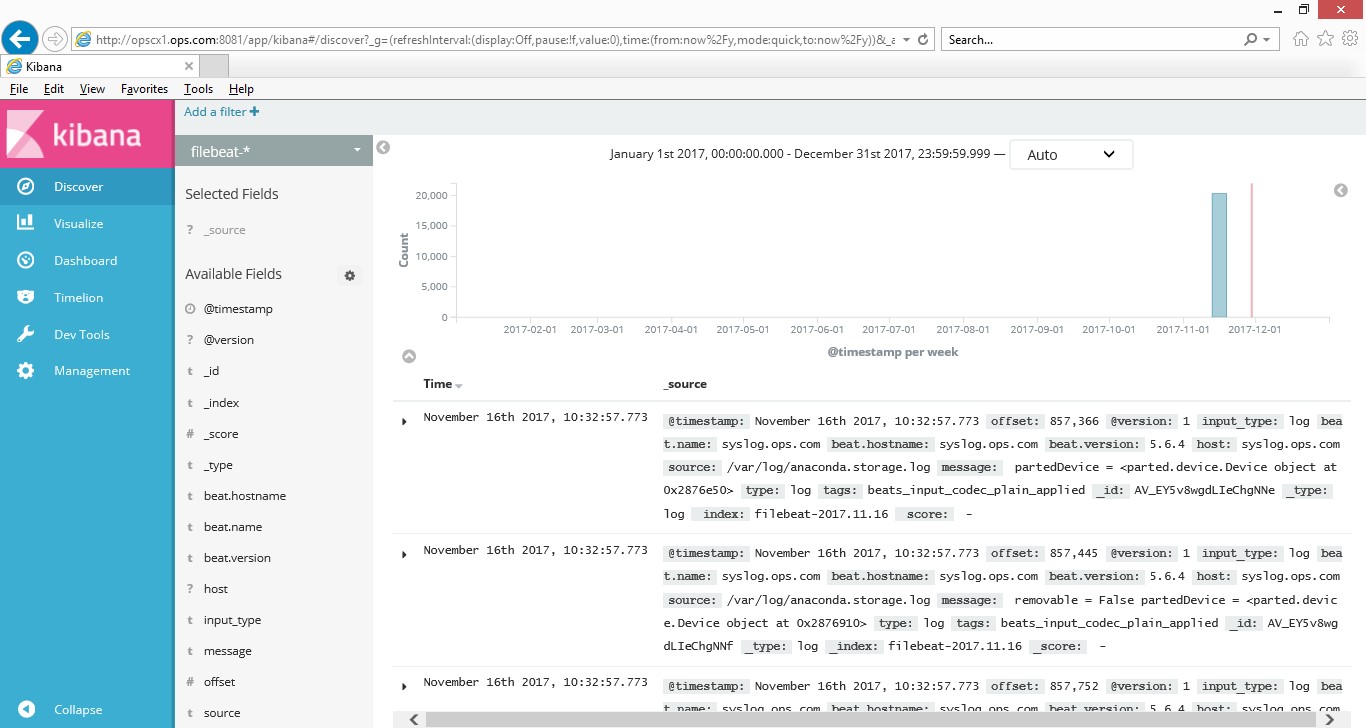
Elasticsearch
Install and config on my RHEL65 server was fairly easy, I had to download a number of rpm files (elasticsearch/logstash/kibana/filebeats) and set up a few dependencies. Once installed I had to use a number of configuring files to get the component’s working, this included the filebeats (agent) to get some data into the elasticsearch engine.
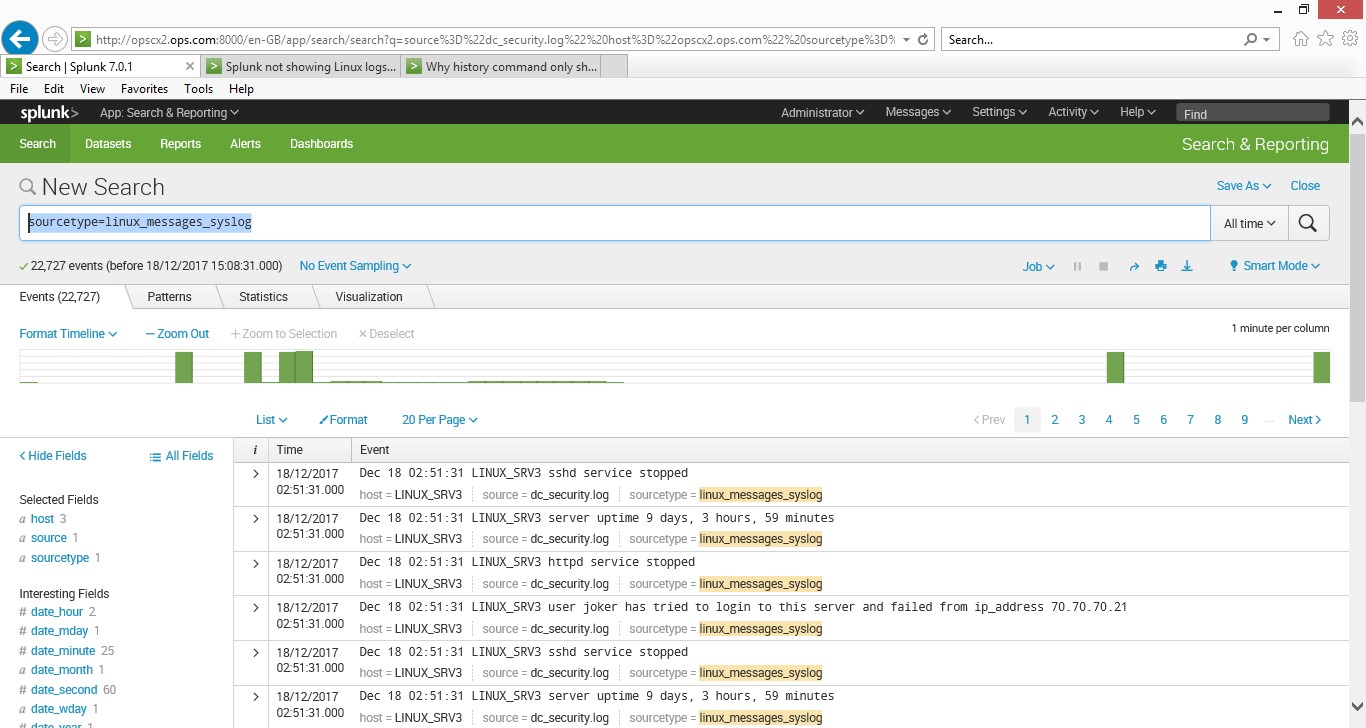
Once the data was in I could run my searches, the data source was linux_secure
Both SIEM tools are good, but in today fast paced world of monitoring, if you want something that fits into the devops mode of operation and get value quickly, then Splunk would be my first choice, if you have time for set up and configuration then Elastic would be just fine, both are good tools. They had good documentation and forum support, they have free versions with limitations. I found Splunk to be easier to install and configure in my lab but for the enterprise you would need to consider many other variables. They are many add-ons via apps and components to enhance the solution to your needs and a lot of good knowledge in the community.
At the enterprise both tools would need to scale for your use cases so a good performance and sizing exercise would need to be carried out as the volume of data ingested will start to grow very quickly, and if the infrastructure is not fit for purpose it can lead to issues in the long run. The infrastructure that supports these tools needs to be future proofed and be easy to scale out should you need to.
Both had cloud (SaaS) based offerings and easy to set up for a trail period.
After my tinkering, I realised by applying the same project principles as I did for systems and application monitoring projects, you can successfully implement SIEM based tools by following a few key steps.
- Analyse from all the organisations stake holders what log data they would like to use for log analysis and define the use cases.
- Create a charter as to what business, technical, functional and non-functional requirements are and define the logging strategy.
- Select the top SIEM playes on the market – Gartner has good articles on this, then run a POC.
- Based on the POC create a design (lld/hld), define the infrastructure, data sources, web, security logs etc, don’t log everything, only data you’re interested in,
- Train and develop skills for admins and users.
- Deploy as per the design in phased manner. Phase 1 should not include everything, only use the critical features functions required, but add more over time, and grow the solution, this way it will be a mature solution.
- Govern and maintain the solution – speed is everything for logging solution, so ensure the infrastructure is performing as it should, and retire old configurations and apps that are not in use. Don’t leave it to sort itself out, if you no longer monitor various components, ensure that data is not being collected and keep it up-to-date.