
Spot process anomalies using Machine Learning Tool Kit
I thought I’d use the Splunk MLTK app to get familiar with it, and apply it to monitor unusual processes.
The app can be found from the below links, you also need the Python for Scientific Computing (for Linux 64-bit)
https://splunkbase.splunk.com/app/2890/
https://splunkbase.splunk.com/app/2882/ (Linux)
I had to ingest windows process data into Splunk, I used the Windows TA – https://splunkbase.splunk.com/app/742/
In production you would use the MLTK on a dedicated server, read the official documentation here https://docs.splunk.com/Documentation/MLApp/4.1.0/User/Installandconfigure
So after installing it I wanted to use the Detect Categorical Outliers which will find events that contain unusual combinations of values, this could be a good way of finding rogue process in your Windows environment.
From the MLTK, click on Experiments, and then Detect Categorical Outliers

Give it a name and create

I wanted to do the experiment on Windows process’s so I used the below SPL
SPL = index=windows sourcetype=WinHostMon Name=*
And then select the Fields you want to analyse which is Name, path, CommandLine, host (This is key to to the machine learning, you need to know which fields will provide data)

Then press Detect Outlier button
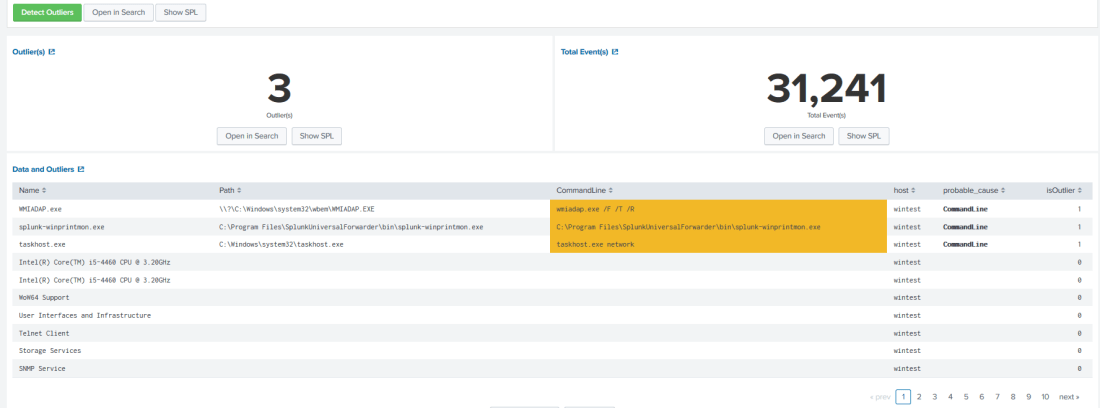
The experiment on this data will show up with some results, you can see from the below screen shot there are some outliers, if there were some unusual process, this may alert you. My lab is limited and I don’t have rogue process, but in the real world this could be a great tool to look for unusual process activity and then send an alert
Here it shows 3 outliers across 31952 events, “This search has completed and has returned 31,952 results by scanning 58,378 events in 4.091 seconds”. This is cool, my test environment is not quite c4.8xlarge but you get my point, if I had a fully optimised Splunk environment it would be faster.
Look at the CommandLine field it shows these are outliers from this server, cool hey, ok this is a false positive, but when you have lots of data, and run this in a production environment, it could be invaluable in showing what process outliers you have in your Windows Environment.
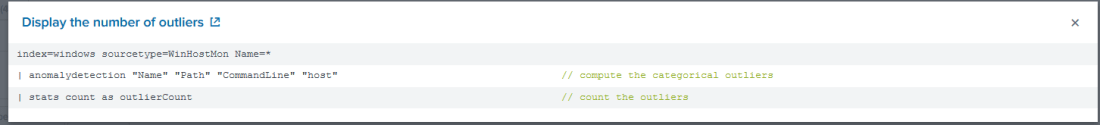
The MLTK also shows you the SPL, which is showing you how the algorithm is ran. You can find out more info on this from here https://docs.splunk.com/Documentation/Splunk/7.2.4/SearchReference/Anomalydetection#Examples
So the Splunk MLTK is a great place to start with anomaly detection and other algorithms, it does requires you to think about what data you want to analyse, so start with some simple experiments and play around until it makes sense to you.
Save the experiment.
Done
