
I wanted to use the COVID-19 data to build a dashboards on this data set, more from a learning exercise and whilst going through the epidemic, it also being different to the security dashboards I tend to work on.
The data used is from John Hopkins
NOTE: Since posting this, the data keeps getting changed, so unless you keep track, the data will not be displayed, but its good for learning.
https://github.com/CSSEGISandData/COVID-19
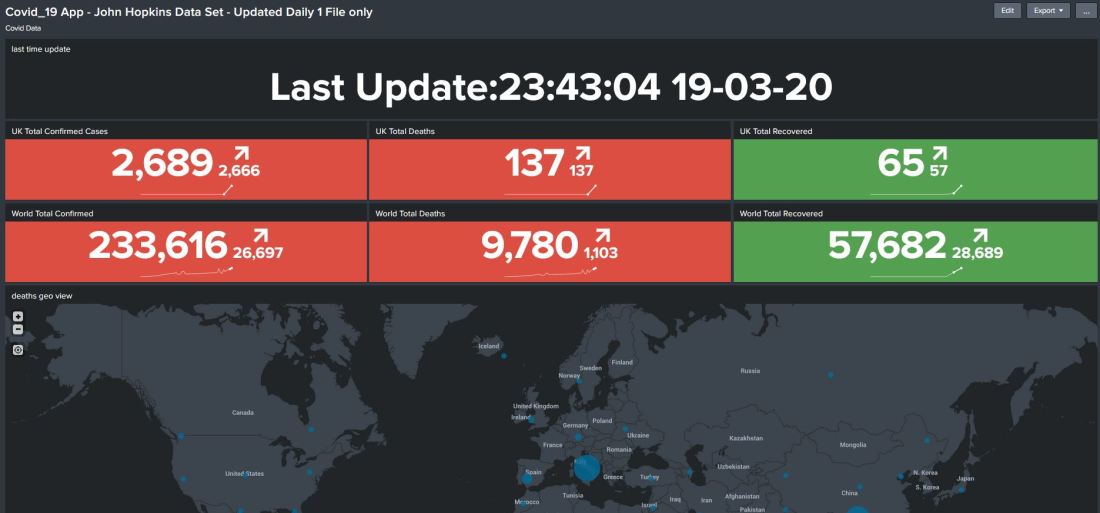
The data shows a number of stats, mainly focused on the UK.
UK Total Confirmed Cases
UK Total Deaths
UK Total Recovered
World Total Deaths
World Total Confirmed
World Total Recovered
Deaths and predicts over time
Table / Confirmed / Recovered / Deaths
Deaths Geo Map
The data is based on CSV and was updated once a day. I used git to copy the csv files and load them into Splunk. This was done using a props and transforms file based on the data and csv format.
The app can be found here, you can download and upload the app, it does contain some initial data, but you will need the shell script to update the data.
