These steps are to configure syslog-ng using Podman in a development environment, once its working plan for a production environment.
I followed all the documentation from the official site, https://splunk-connect-for-syslog.readthedocs.io/en/master/ but wanted to get my head around it all, so I put this blog as a reference point.
You can use Docker if you want, I preferred Podman. (Redhat have their own container called Podman)
Podman consists of just a single command to run on the command line. There are no daemons in the background doing stuff, and this means that Podman can be integrated into system services through systemd)
You will need to understand how Spunk works under the hood, have some basics of syslog and containers, so get with the program before you start!
Pre-requisites
Step 1 Configure Indexes (These will be used by the SC4S connector), the default indexes can be changed, but use these as a starting point.
indexes.conf
[email]
homePath = $SPLUNK_DB/email/db
coldPath = $SPLUNK_DB/email/colddb
thawedPath = $SPLUNK_DB/email/thaweddb
frozenTimePeriodInSecs =604800
maxTotalDataSizeMB = 512000
[netauth]
homePath = $SPLUNK_DB/netauth/db
coldPath = $SPLUNK_DB/netauth/colddb
thawedPath = $SPLUNK_DB/netauth/thaweddb
frozenTimePeriodInSecs =604800
maxTotalDataSizeMB = 512000
[netfw]
homePath = $SPLUNK_DB/netfw/db
coldPath = $SPLUNK_DB/netfw/colddb
thawedPath = $SPLUNK_DB/netfw/thaweddb
frozenTimePeriodInSecs =604800
maxTotalDataSizeMB = 512000
[netids]
homePath = $SPLUNK_DB/netids/db
coldPath = $SPLUNK_DB/netids/colddb
thawedPath = $SPLUNK_DB/netids/thaweddb
frozenTimePeriodInSecs =604800
maxTotalDataSizeMB = 512000
[netops]
homePath = $SPLUNK_DB/netops/db
coldPath = $SPLUNK_DB/netops/colddb
thawedPath = $SPLUNK_DB/netops/thaweddb
frozenTimePeriodInSecs =604800
maxTotalDataSizeMB = 512000
[netproxy]
homePath = $SPLUNK_DB/netproxy/db
coldPath = $SPLUNK_DB/netproxy/colddb
thawedPath = $SPLUNK_DB/netproxy/thaweddb
frozenTimePeriodInSecs =604800
maxTotalDataSizeMB = 512000
[netipam]
homePath = $SPLUNK_DB/netipam/db
coldPath = $SPLUNK_DB/netipam/colddb
thawedPath = $SPLUNK_DB/netipam/thaweddb
frozenTimePeriodInSecs =604800
maxTotalDataSizeMB = 512000
[oswinsec]
homePath = $SPLUNK_DB/oswinsec/db
coldPath = $SPLUNK_DB/oswinsec/colddb
thawedPath = $SPLUNK_DB/oswinsec/thaweddb
frozenTimePeriodInSecs =604800
maxTotalDataSizeMB = 512000
[osnix]
homePath = $SPLUNK_DB/osnix/db
coldPath = $SPLUNK_DB/osnix/colddb
thawedPath = $SPLUNK_DB/osnix/thaweddb
frozenTimePeriodInSecs =604800
maxTotalDataSizeMB = 512000
[em_metrics]
homePath = $SPLUNK_DB/em_metrics/db
coldPath = $SPLUNK_DB/em_metrics/colddb
thawedPath = $SPLUNK_DB/em_metrics/thaweddb
datatype = metric
frozenTimePeriodInSecs = 2419200
repFactor = auto
Step 2
Configure HEC
Create an HEC app and Deploy it onto the AIO or your indexer endpoint – Change the TOKEN or use the one below, it’s only for dev purposes.
#This is to enable HEC
[http]
disabled = 0
port = 8088
#This is default sources
[http://syslog]
disabled = 0
index = syslog_test
token = df800b50-6ab6-4830-a080-efc3f0e7b2f3
sourcetype = syslog:unassigned
indexes = email,main,netfw,netids,netipam,netops,netproxy,osnix,oswinsec,syslog_test,em_metrics
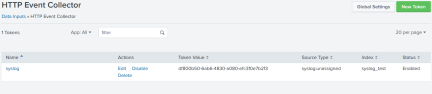
Step 3 Ensure the indexes and HEC points are available in Splunk
Some of Indexes – Example

HEC Endpoint
Step 6 Remove Rsyslog
As this comes with most Linux OS platforms, its already running, if not then move onto the next step, otherwise remove it, or you will get conflicts port 514 etc
sudo systemctl stop rsyslog.service
sudo systemctl disable rsyslog.service
(Removed symlink /etc/systemd/system/multi-user.target.wants/rsyslog.service)
sudo yum remove rsyslog
Step 5 Install Podman
sudo yum install git
sudo yum -y install podman
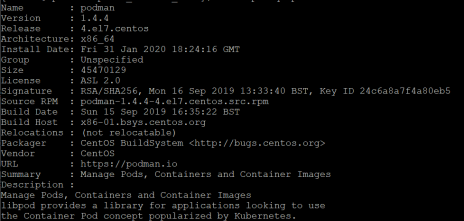
Check podman install
sudo rpm -qi podman
sudo podman info
Step 6 Config Podman Service
cd /lib/systemd/system
sudo vim ./sc4s.service
Add the below
[Unit]
Description=SC4S Container
Wants=NetworkManager.service network-online.target
After=NetworkManager.service network-online.target
[Install]
WantedBy=multi-user.target
[Service]
Environment=”SC4S_IMAGE=splunk/scs:latest”
# Required mount point for syslog-ng persist data (including disk buffer)
Environment=”SC4S_PERSIST_VOLUME=-v splunk-sc4s-var:/opt/syslog-ng/var”
# Optional mount point for local overrides and configurations; see notes in docs
Environment=”SC4S_LOCAL_CONFIG_MOUNT=-v /opt/sc4s/local:/opt/syslog-ng/etc/conf.d/local:z”
# Optional mount point for local disk archive (EWMM output) files
# Environment=”SC4S_LOCAL_ARCHIVE_MOUNT=-v /opt/sc4s/archive:/opt/syslog-ng/var/archive:z”
# Uncomment the following line if custom TLS certs are provided
# Environment=”SC4S_TLS_DIR=-v /opt/sc4s/tls:/opt/syslog-ng/tls:z”
TimeoutStartSec=0
Restart=always
ExecStartPre=/usr/bin/podman pull $SC4S_IMAGE
ExecStartPre=/usr/bin/podman run \
–env-file=/opt/sc4s/env_file \
“$SC4S_LOCAL_CONFIG_MOUNT” \
–name SC4S_preflight \
–rm $SC4S_IMAGE -s
ExecStart=/usr/bin/podman run -p 514:514 -p 514:514/udp -p 6514:6514 \
–env-file=/opt/sc4s/env_file \
“$SC4S_PERSIST_VOLUME” \
“$SC4S_LOCAL_CONFIG_MOUNT” \
“$SC4S_LOCAL_ARCHIVE_MOUNT” \
“$SC4S_TLS_DIR” \
–name SC4S \
–rm $SC4S_IMAGE
Step 7 Create Folders
Run
sudo podman volume create splunk-sc4s-var
(Creates folder in /var/lib/containers/storage/volumes/)
Run
sudo mkdir /opt/syslog-ng
sudo mkdir /opt/syslog-ng/var
sudo mkdir /opt/sc4s
sudo mkdir /opt/sc4s/local
sudo mkdir /opt/sc4s/archive
sudo mkdir /opt/sc4s/tls
Step 8 Create environment file and add config
sudo vim /opt/sc4s/env_file
Add the below (Change your host name and token if need be – leave the TLS for now you can do that later if you want)
SPLUNK_HEC_URL=https://CHANGE TO YOUR SPLUNK SERVER NAME:8088
SPLUNK_HEC_TOKEN=df800b50-6ab6-4830-a080-efc3f0e7b2f3
SC4S_DEST_SPLUNK_HEC_WORKERS=6
#Uncomment the following line if using untrusted SSL certificates
SC4S_DEST_SPLUNK_HEC_TLS_VERIFY=no
Step 9 Start Sc4S
sudo systemctl daemon-reload
sudo systemctl enable sc4s
sudo systemctl start sc4s
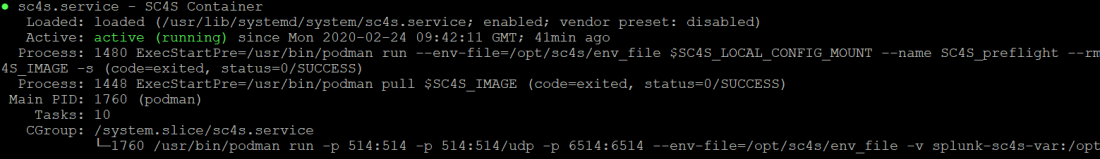
Step 10 Check podman status
sudo systemctl status sc4s
sudo podman ps –a
Step 11 Login to Splunk and check service
The below should show some data coming from the connector, its normally in the main index.

Due my lab limitations I don’t have syslog devices, but the above should get you to a good point in the dev environment, so now focus on the common syslog devices it supports and get some data in, see the SOURCES section in the below link!
For further SC4S documentation, click on this link
https://splunk-connect-for-syslog.readthedocs.io/en/master/#welcome-to-splunk-connect-for-syslog
I will look at using non-root for this service, TLS, and configuring extra storage another time, which is all in the above link.